Metrics and charts
Follow your experiments in River Console while they train. Report training signals such as loss and reward, evaluation results such as accuracy, performance measurements such as throughput, or any other number your experiment produces. Console charts each metric for its training run and compares runs side by side in a project.
Metrics come from your existing training script. They use the same River API key and attach to the model you are training, so there is no extra service to set up.
Requires
river-client0.14.0 or later.
Report metrics from your training loop
Add logging to your existing model and training loop. This example uses
batches prepared as in Your first SFT run:
import os
from contextlib import closing

import river_client as river

with closing(river.Client(api_key=os.environ["RIVER_API_KEY"])) as client:
    with client.session(project="reasoning-ablations", run="lr-2e-4") as session:
        model = session.create_model(
            base_model="Qwen/Qwen3.5-9B",
            lora=river.LoraConfig(rank=8),
        )
        model.define_metric("update", hidden=True)
        model.define_metric("train/*", step_metric="update")

        print(f"https://console.river.ai/training/{model.training_run_id}/metrics")

        for update, batch in enumerate(batches, start=1):
            result = model.forward_backward(batch, loss_fn="cross_entropy")
            model.optim_step(lr=2e-4)
            model.log({"update": update, "train/loss": result.metrics["loss"]})
Each model.log(data) call records one complete observation. The example
logs a loss and its update coordinate together. hidden=True keeps update
out of the automatic chart grid; its values are still stored and used as the
x axis. The train/* definition applies to every metric whose name starts with
train/, so you can add train/reward or train/grad_norm in the same way.
Values must be finite Python or NumPy integers or floats. Convert a scalar
tensor with .item() before logging it. Booleans, strings, arrays, nested
objects, NaN, infinity, and empty dictionaries are not accepted.
Choose the x axis
Include the coordinate in the same call as every metric that uses it.
River does not carry coordinates forward from an earlier call or read
model.step for you. There are no step= or commit= arguments.
Training and evaluation can use different coordinates
An evaluation can finish after training has advanced. Log the step of the checkpoint you evaluated, not the model's current step:
model.define_metric("eval_step", hidden=True)
model.define_metric("eval/*", step_metric="eval_step")

# evaluated_step and accuracy come from your evaluation of that checkpoint.
model.log({"eval_step": evaluated_step, "eval/accuracy": accuracy})
The first example uses your loop's update count. If you need the committed
optimizer step, use OptimStepResult.policy_version.step when the result
provides it. model.step advances on submission, including failed operations,
so it is not a reliable coordinate for delayed or pipelined work. See
Policy versions.
Plot against time
Every observation includes two automatic coordinates:
| Coordinate | Meaning |
|---|---|
_river/timestamp | Unix time in seconds when log() was called. |
_river/runtime | Seconds since this model was created, not since the first log call. |
Use either in a definition without logging it yourself:
model.define_metric("perf/*", step_metric="_river/runtime")
model.log({"perf/step_seconds": step_seconds})
The _river/ prefix is reserved; do not log or define names under it. Choose an
axis explicitly rather than relying on the order in which observations arrive.
Set chart defaults
model.define_metric(name, *, step_metric=None, hidden=None) accepts an exact
name, "*", or a prefix ending in "*", such as "train/*". Exact names take
precedence over patterns; otherwise, the longest matching prefix wins.
Repeating a definition updates only the options you supply. The latest
definitions apply to the whole run history without changing recorded values.
A missing configured coordinate produces an SDK warning, but the metric value is kept. That observation cannot be plotted against the missing coordinate; a later call does not fill it in. Repeated coordinates remain separate observations.
Find your charts in Console
- Sign in to River Console and select the personal or team account whose API key created the run.
- Open Training runs, select your run, and open Metrics. You can also
open the URL printed by the example:
https://console.river.ai/training/<training_run_id>/metrics. - Find your metric in the chart grid. Pin frequently used metrics to keep them at the top. Enlarge a chart to inspect it and use its smoothing controls. Smoothing changes the display, not the stored values.
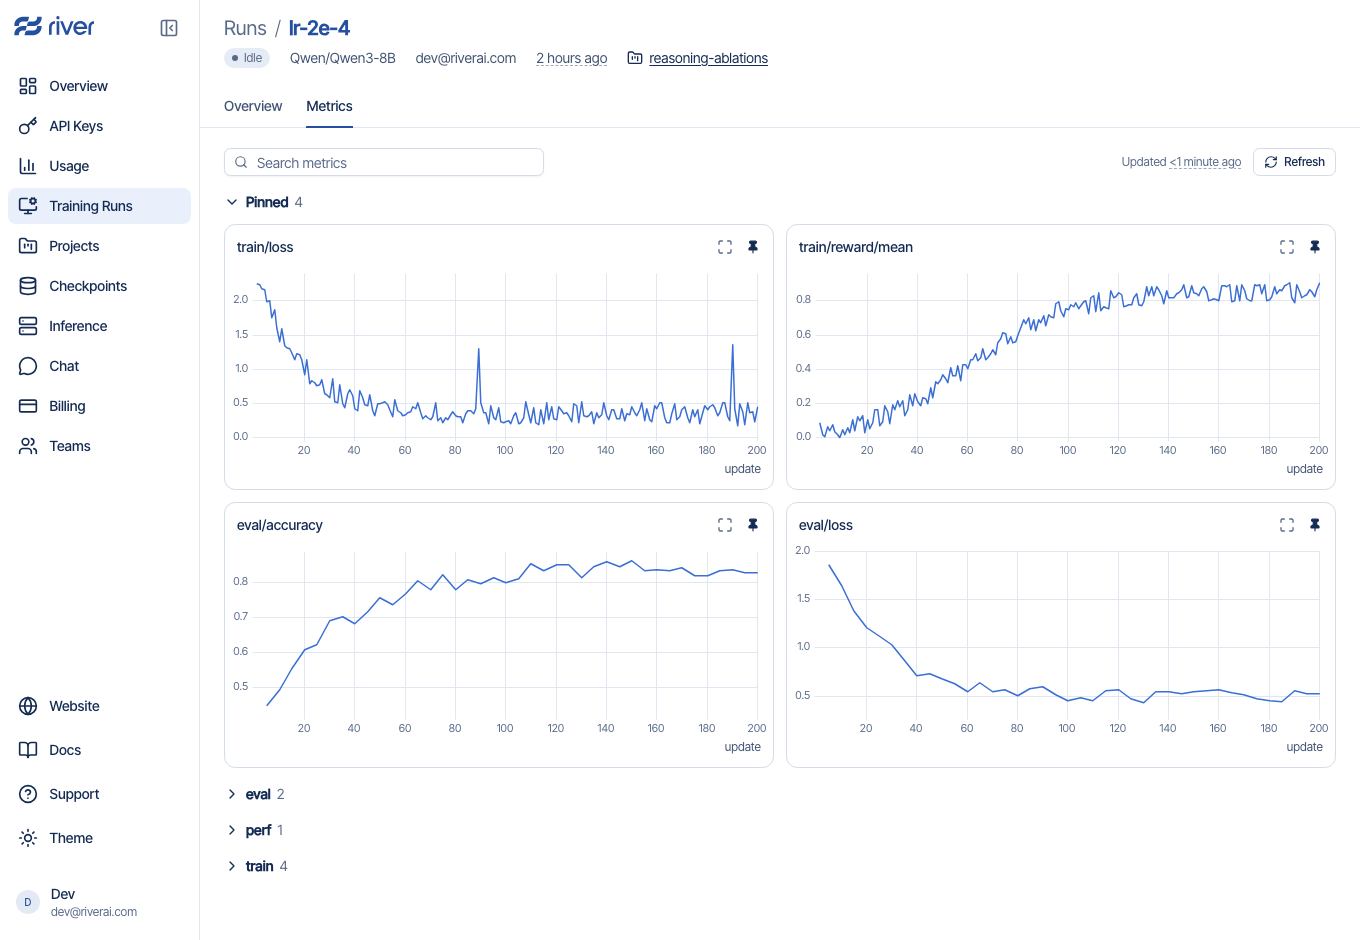
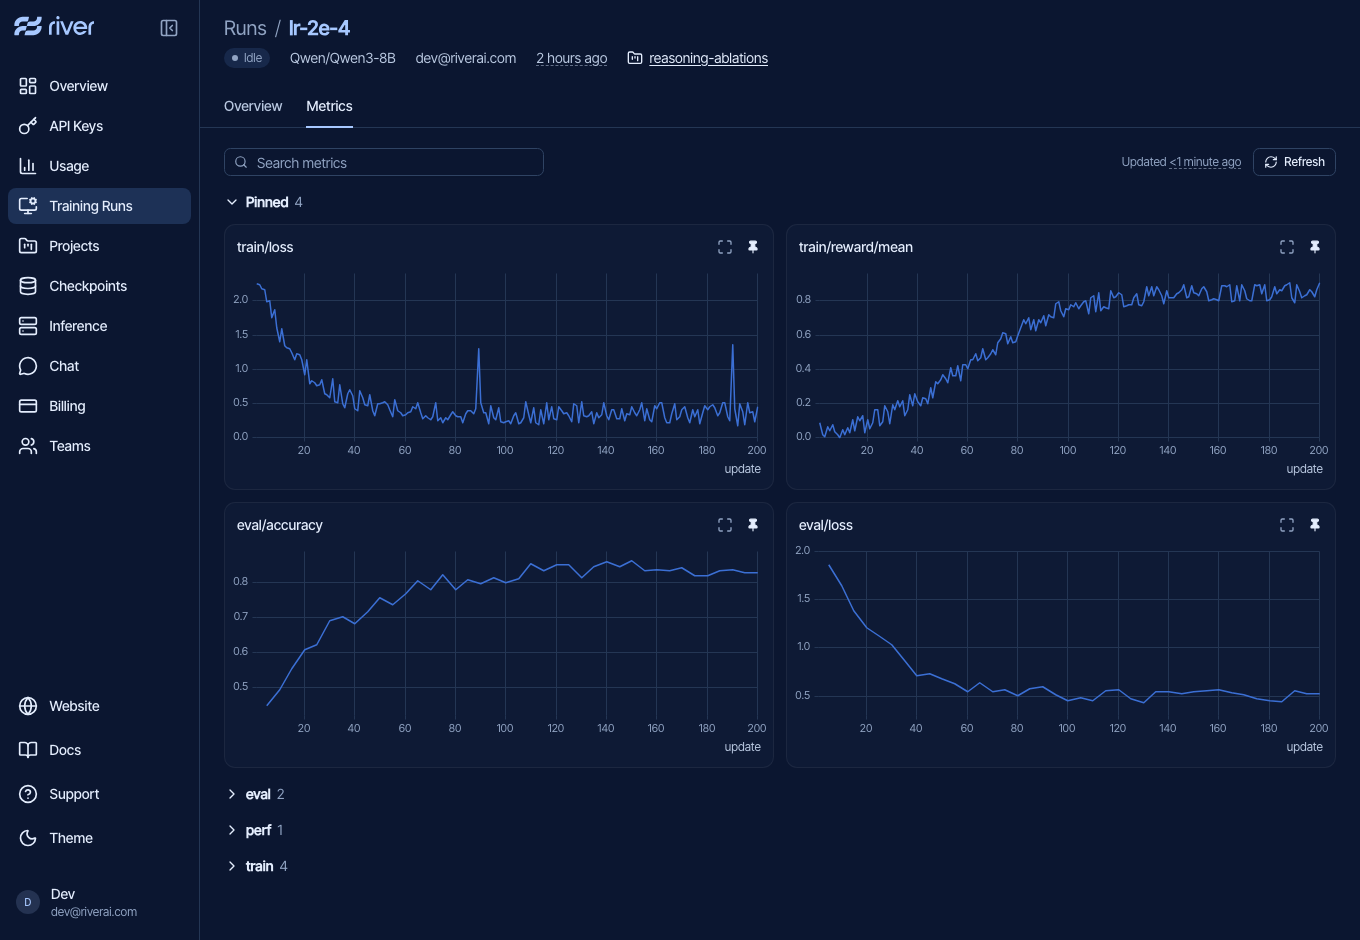
Run metrics in Console with 200 synthetic training points and evaluation every five updates, not measured model performance. Open the image for a larger view.
Compare runs in a project
Set project and run when you create the session, as in the training example:
projectplaces new training runs in the named Console project, creating the project if needed under the API key's personal or team account.rungives the runs a readable name in Console and in project chart legends. Use different names for experiments you want to compare.
For a second experiment, create a new session with the same project and a
different run name, for example run="lr-5e-5", and change its learning rate.
Log the same metric names and coordinates in both runs.
Open Projects in Console, select reasoning-ablations, and select the runs you want to compare. The charts show their metric histories together.
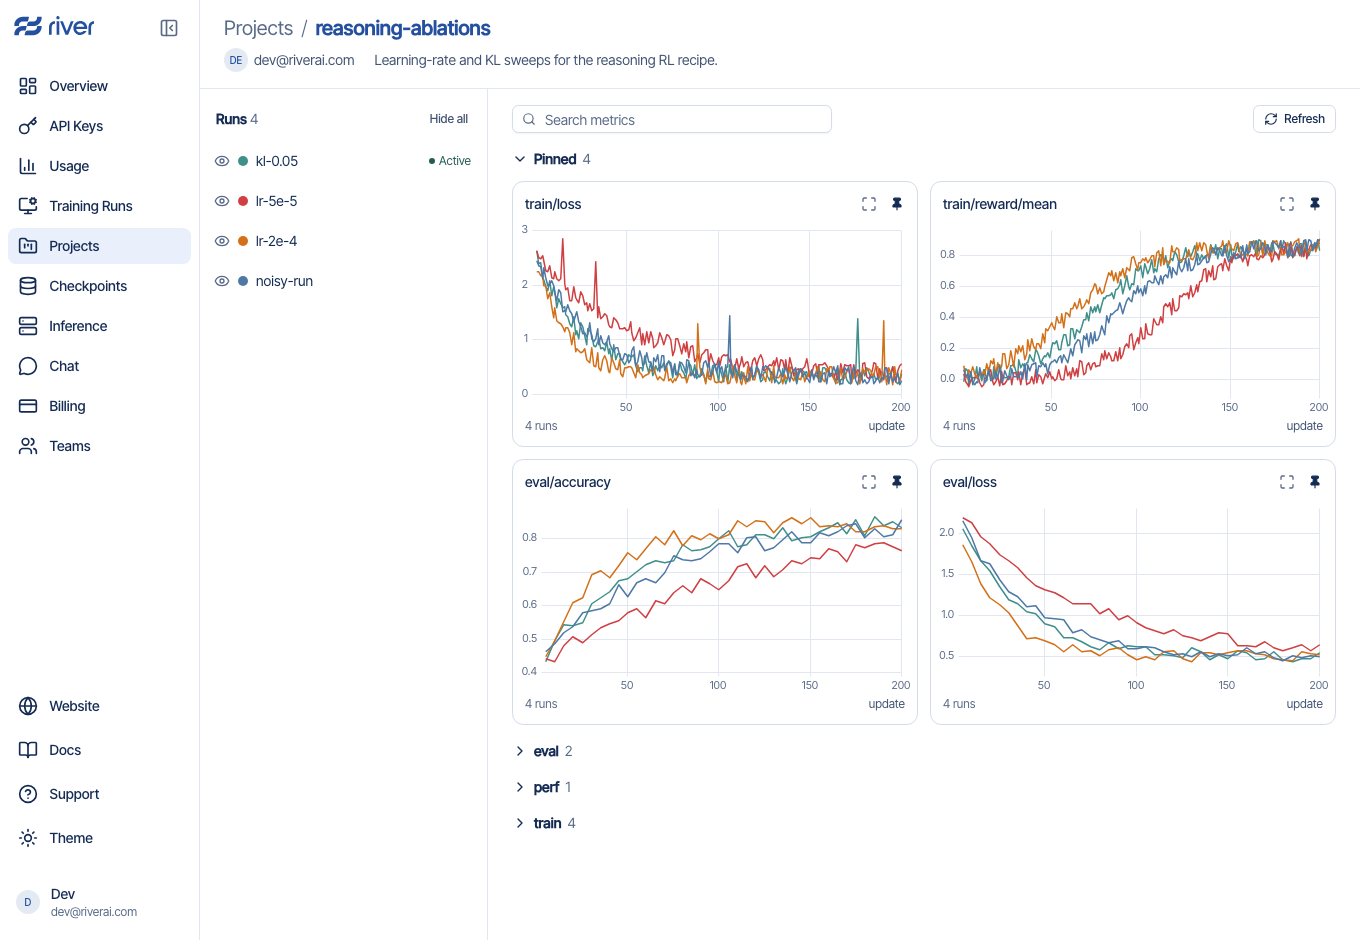
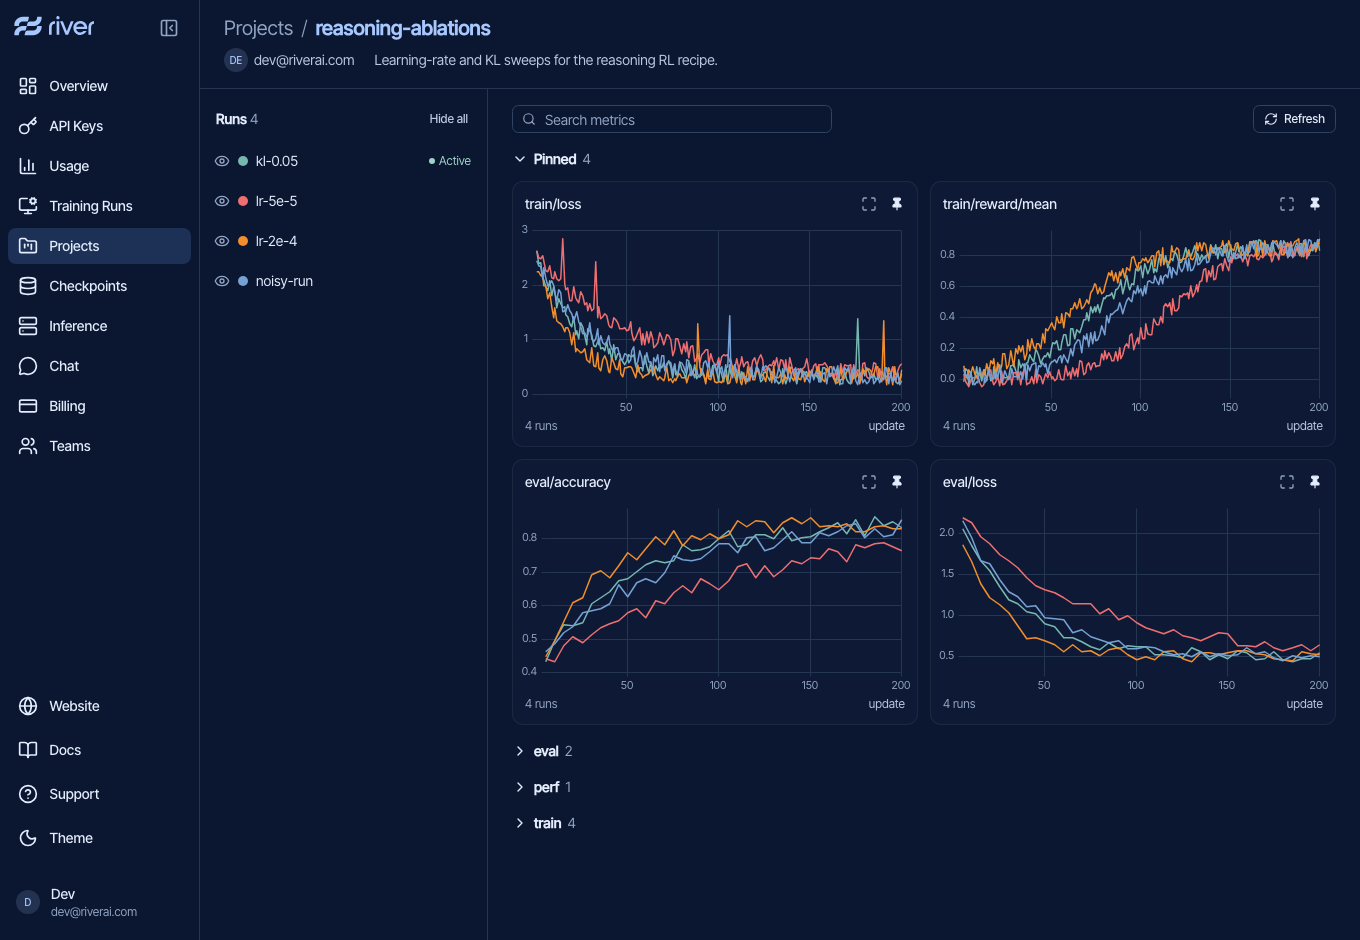
Neither tag is required to log metrics. Project assignment is asynchronous and best-effort, so check the project's run list if a run is missing. Changing tags later does not move existing runs into a project. Reusing a run name does not merge distinct training runs or stitch their histories across restarts.
Delivery and shutdown
Logging buffers observations in memory and uploads them in the background,
normally every two seconds or when a batch fills. Network and server delivery
failures do not stop training. Invalid API usage still raises TypeError or
ValueError immediately.
Keep the normal session context and client.close() cleanup, as shown by
closing(...) in the example. Cleanup can wait up to 30 seconds for buffered
metrics. There is no separate finish() call.
Delivery is best-effort, not durable. The buffer is bounded to 10,000 values or 8 MiB, including in-flight data and definitions. Overflow drops the oldest queued observations; abrupt termination loses unsent data. SDK warnings report dropped, rejected, or unconfirmed observations. Log from the process that created the model, not a forked child inheriting it.
If metrics do not appear
- Missing methods: check the SDK installed in the running process, not just your local environment. A Console deployment does not update the Python SDK.
- Empty run page: allow for background delivery, refresh the charts, and check the SDK warnings. Verify the run ID and the account selected in Console.
- A metric has no points on its chosen axis: include that coordinate in the
same
log()call as the metric. Check that the metric is not hidden. - The run is absent from a project: verify membership in the project's run
list; a
projecttag in the runs table is not proof of membership. - Metrics or Projects is absent from navigation: contact River support to check whether the feature is enabled for your account.